It’s been quite the week for sports fans! Just a day after our Stanley Cup coverage, we’re coming at you today with a look at how this year’s NBA Finals affected traffic flow on Pornhub. We’ve tracked how this colossal sporting event has caused fluctuations in regular site traffic both in 2014 and 2013 and our statisticians have just now delivered this year’s results. As we all know by now, the Warriors came out to play and won the first Golden State Championship in 40 years, so let’s take a look at how it all went down with regards to Pornhub.
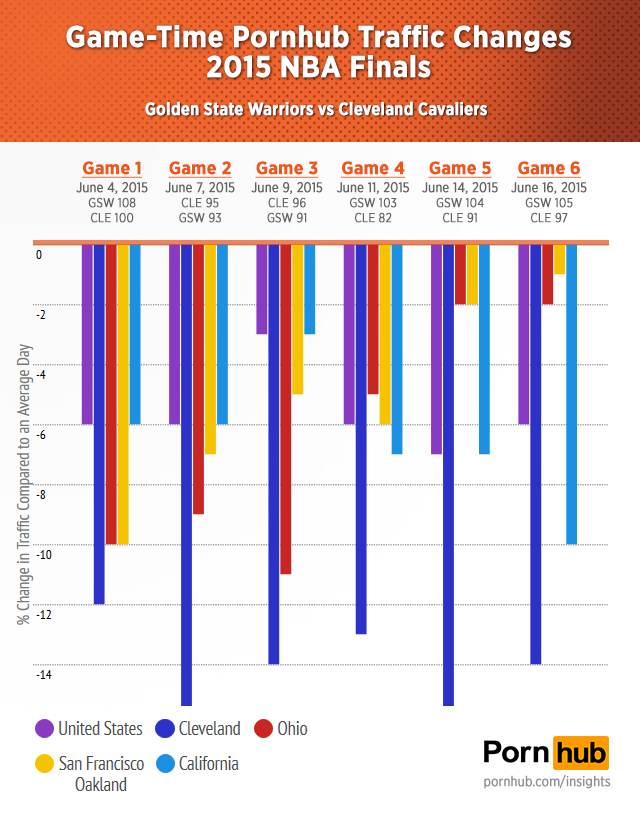
We’ll begin with a general overview of how traffic rates changed in a few relevant locations throughout the Championship Series, featuring Lebron’s return to the finals with his hometown team against 2015’s best team in basketball lead by Steph Curry. The chart below details how numbers fluctuated over the course of the 6 games in the United States in general, in Cleveland, within the State of Ohio, in the Bay Area and within the State of California. What immediately jumps out here is that overall, Cleveland appears to have been the most affected in that during every game, the traffic drops were the most severe there, dipping by at least 12% on average each time. Overall, the United States showed more interest in the Championship Series than they did last year, in that traffic was down by about 6% nationwide on average throughout, compared to just 3% in 2014.
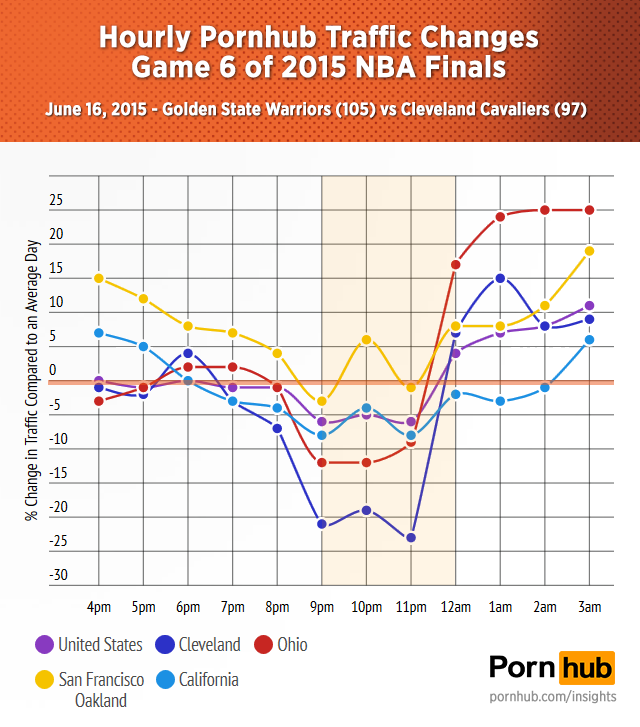
We also observed some interesting traffic patterns during Game 6, which we will now look at in more depth, within the same geographical locations. As we have seen during other sporting events like the Super Bowl and the World Cup, it is common for game day traffic to chart in the shape of an upside down parabola. This means that traffic tends to fall around average rates or slightly higher in earlier hours of game day, then dips down right before and during the game and gradually rises back up to above or around average again once the game has come to an end.

The same was observed during game 6, in that perhaps in anticipation of the home team claiming their first championship in 40 years, Bay Area traffic was up by 15% at 4pm, and gradually dipped down as game time approached. Elsewhere, traffic more or less hovered around average pregame, but dipped much more significantly during the game. This was especially true in Cleveland where traffic dropped by as much as 23%. A slight recovery was noted on all fronts during half time, when folks took advantage of the break to get a quick Pornhub session in, but the really impressive climbs took place once the game ended. In both the winning Bay Area and the losing city of Cleveland, traffic shot way up. The State of Ohio was easing their pain with traffic rates at 25% above average in the hours following the game, while folks in the victorious metropolitan area were celebrating on Pornhub, as noted with the 20% increase in traffic observed a few hours after the game ended.
That’s it for our 2015 NBA Championship overview! Stay tuned for more awesome Pornhub Insights and be sure to drop us a line in the comment section below.


Hi,
Swedish people is the 9:th biggest user base you have (per capita), yet you haven’t released any insights or statistics on how we search or what porn we tend to like. Please make a swedish insight, you’ve made it for almost all the other european countries!
It’s on our list!
Is `% Change in Traffic` significant when seasonally adjusted?
not too sure what you mean? these dips that were recorded are compared to average traffic rates on a regular day.
An average Wednesday is different to an average Saturday and an average day 4th of July day is different to an average 25th of December day. Taking seasonality into consideration, is the % change in traffic still significant?
Yes. Our statisticians take all of this into account when calculating changes in traffic.