This past Sunday was Super Bowl 57, with the Kansas City Chiefs facing off with the Philadelphia Eagles. Kansas City Chiefs took the lead with 38 while the Eagles came in close behind at 35. Viewers were no doubt at the edge of their seat. However, that didn’t completely stop some of them from sneaking off for a visit to their favorite website.
Search Terms
As with any event, we love to look at how traffic changes during the day. First, we looked at the search terms. What were people looking up on game day? There was definitely a theme here, with sports and sport-adjacent terms seeing major spikes in popularity. The term, “super bowl” saw an increase of +4421%, while the term “super bowl party” increased +1861%, and the term “naked football” increased +173%.
Terms containing the word “football” saw an all around increase. First, “football” itself was up +166%, “football team gangbang” was up +114%, as was “football player.” Additionally, terms including the word “cheerleader” were up as well. “Football player fucks cheerleader” was up +45%, “hot naked cheerleaders” was up +32%, and “lesbian cheerleaders” was up +28%.
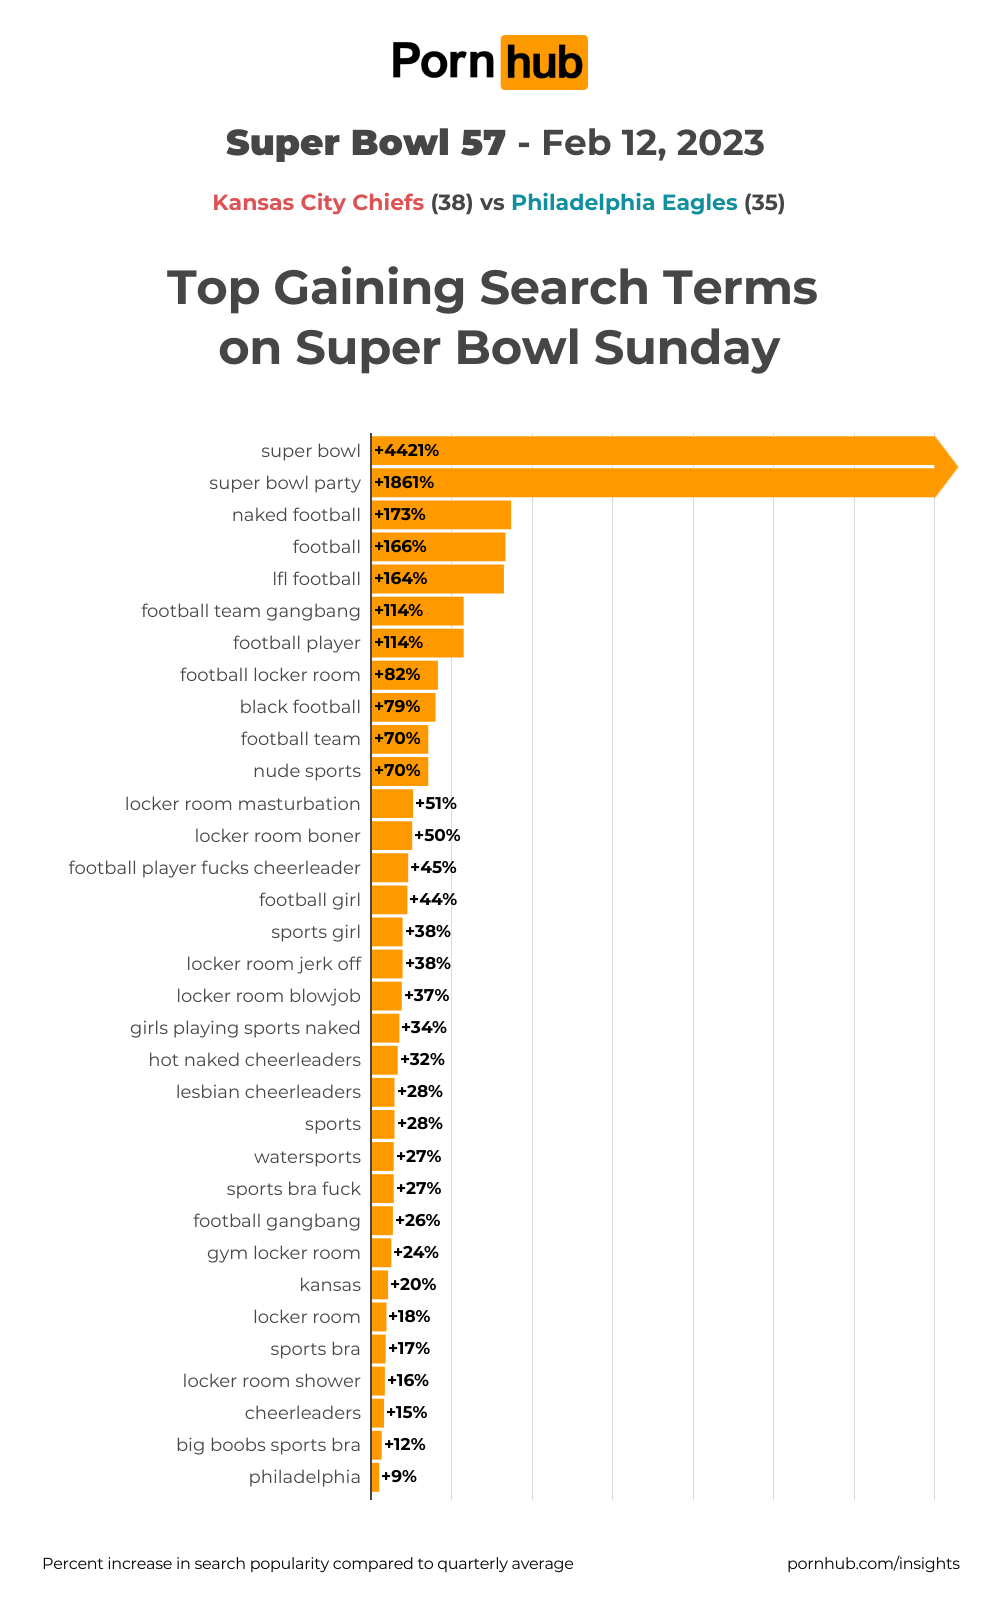
We also saw a surge in popularity around locker room-based terms. “Football locker room” was up +82%, “locker room masturbation” was up +51%, “locker room boner” was up +50%, “locker room jerk off” was up +38%, and “locker room blowjob” was up +37%.
In addition to sport-theme searches, we also saw an increase in location-based terms. The term “Kansas” was up +20%, whereas “Philadelphia” was only up +9%. Since the Kansas City Chiefs took home the Super Bowl this year, it’s no surprise Kansas had a higher surge in popularity.
Hourly Traffic
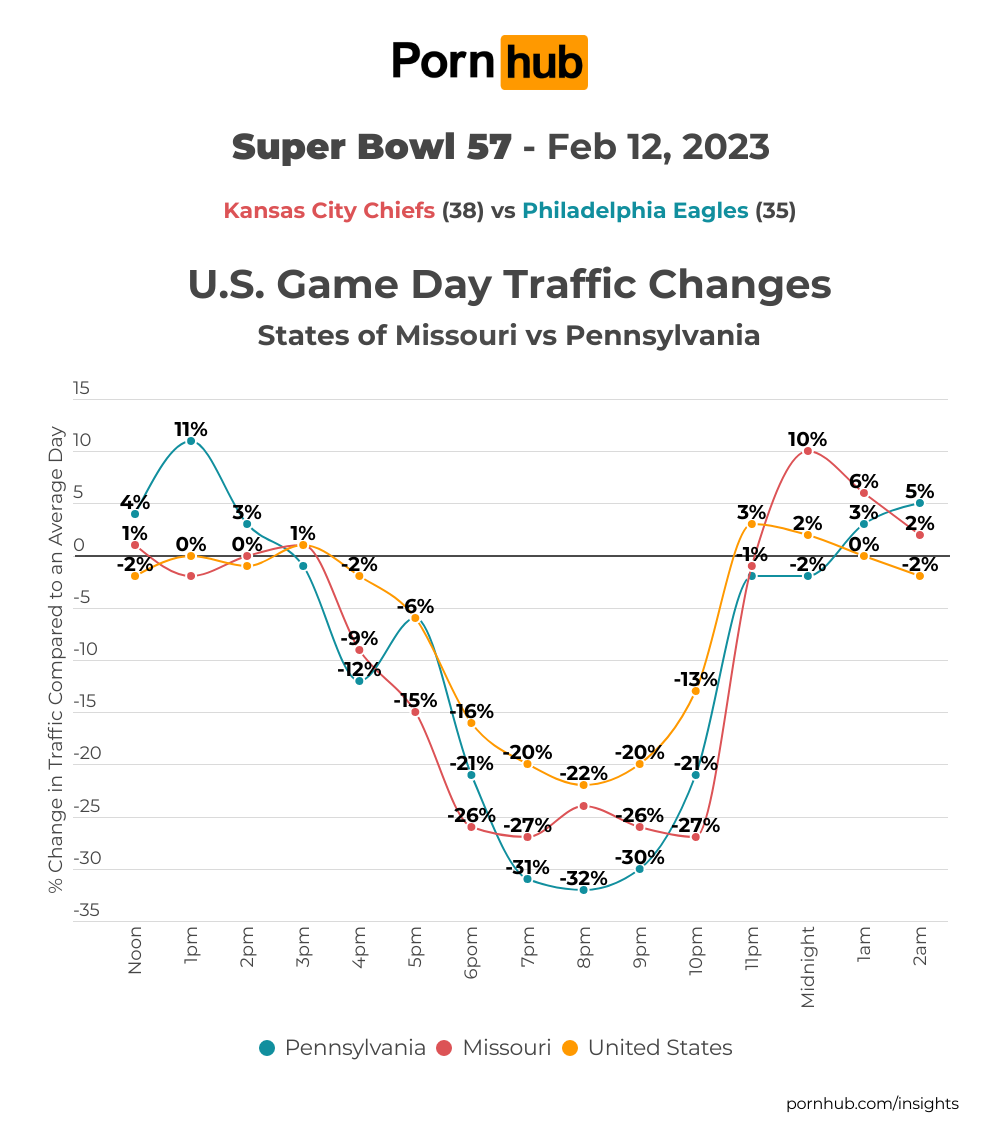
The numbers of the playing cities were consistent with the states the cities are located in. We saw some very minor differences with Kansas City and the state of Missouri. Kansas City did have a higher increase in traffic before the Super Bowl started, in comparison to the rest of the state.
Alternatively, we saw a much bigger afternoon spike in traffic from the state of Pennsylvania than the city of Philadelphia. At 1pm, the state of Pennsylvania’s traffic was up +11%, whereas in the city of Philadelphia, traffic was down -2%.
Next, we looked at the traffic changes for Philadelphia, Kansas City, and the rest of the United States. From noon until 3pm, averages were consistent. Philadelphia had an increase of +5% by 3pm and +2% by 4pm, whereas Kansas City had an increase of 0% at 3pm and a decrease of -13% at 4pm. Who was pre-gaming harder? That’s for you to decide!
After 4pm, traffic dropped considerably until around 11pm, after the Super Bowl was over. The largest drop we saw from Philadelphia happened equally at 7pm and 9pm, with -35% below average. For Kansas City, the largest drop happened around 10pm, with a drop of -31% below average.
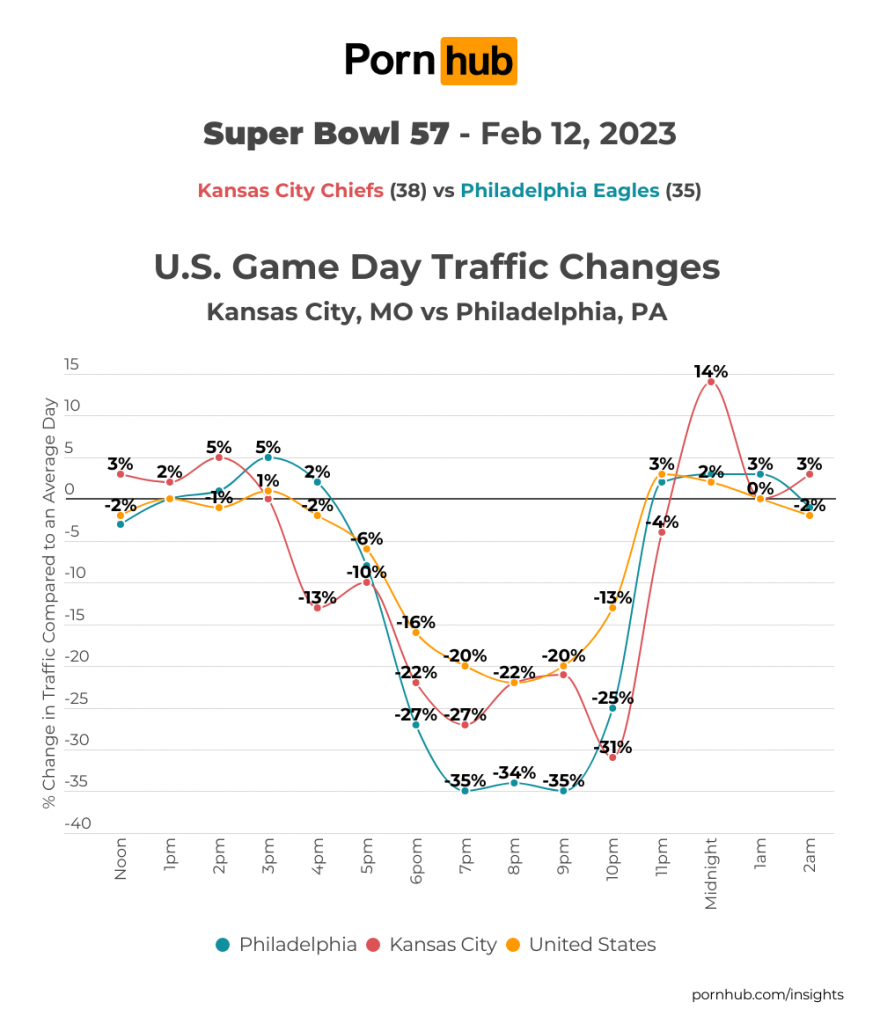
In stark contrast to this, the rest of the United States as well as Kansas City dropped to only -22% around 8pm, while Philadelphia retained a consistent -34% drop. This was during the halftime show. This tells us that while 12% more of the rest of America took that time to visit Pornhub, Philadelphia stuck around to watch the halftime show uninterrupted!
As the game ended, with Kansas City celebrating their win, we saw a big increase of about +14% by midnight. Philadelphia, on the other hand, seemed to have less to celebrate, with a minor increase of only +2% by midnight. By 1am, Kansas City traffic was back to their average numbers, as was the rest of America.
Traffic by State
Next, we broke the traffic numbers down by state. To nobody’s surprise, traffic was down across America, to the tune of -22% during game time, when compared to an average Sunday’s traffic. What was interesting here was the scope of those differences. The highest drop in traffic occurred in D.C, with a drop of -45%. Following closely behind D.C was Hawaii, with a -42% drop, and then Wisconsin, with a -38% drop.
The states that saw the least drop in traffic were Ohio, with a drop of -10%, followed by Arkansas with -14% and Maine with -15%. Interestingly enough, Pennsylvania and Missouri were tight together with their drops; Pennsylvania having a drop of -27% and Missouri having a drop of -26%.

Historic Super Bowl Traffic Changes
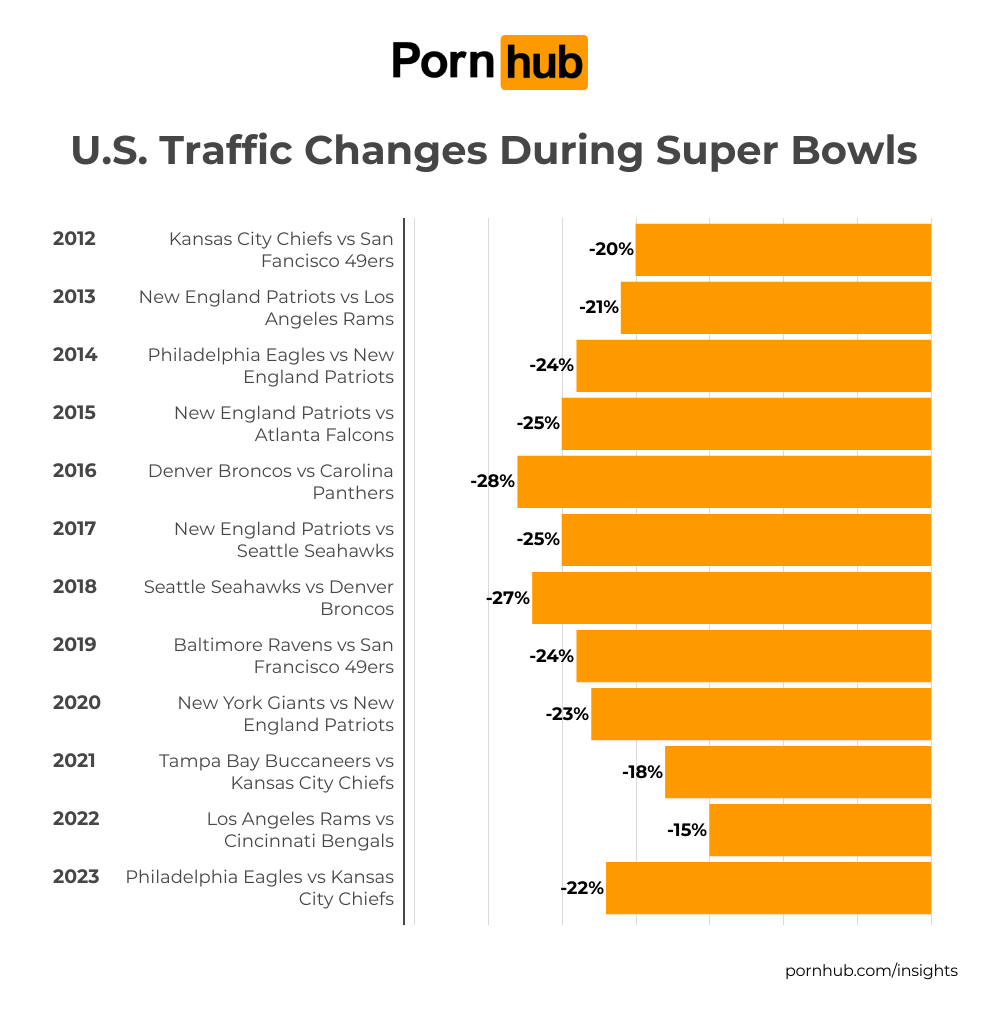
The traffic changes during the Super Bowl over the years have always been an interest to Pornhub’s statisticians. And the further we investigate, the more consistent the numbers tend to be. In 2012, when the Kansas City Chiefs played the San Francisco 49ers, the drop in traffic was -20%. That number gradually increases until 2016, when the Denver Broncos played the Carolina Panthers and traffic to Pornhub dropped -28%.
Since 2019, those numbers have started to drop, meaning fewer people were interested in the game and Pornhub saw lower drops in traffic on game day. In 2019, traffic dropped -24%, 2020 traffic dropped -23%, 2021 traffic dropped -18% and then 2022 saw the lowest drop of the last decade, with a small drop of -15% when the Los Angeles Rams played the Cincinnati Bengals.
Until next year, we hope you enjoyed this edition of Super Bowl Insights!